

Monday, April 30, 2012
GBP/USD - Bearish Butterfly - Weekly Chart
Bearish Butterfly pattern has formed on Weekly - GBP/USD. Price may run up to complete AB = CD pattern. D projection is at 1.6364. The 127.2% Fibonacci extension of XA is at 1.6418. This would be a valid level for price to go to also. Look for clues for a turnaround on shorter-term charts.

Monday, April 23, 2012
GBP/USD - Daily Chart - Hammer Forming
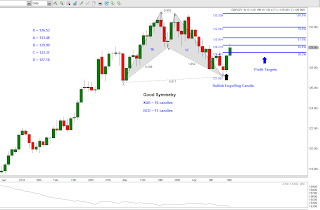
Hanging Man (Bearish) pattern has formed on Daily GBP/USD chart. This goes along with our Bearish Butterfly formation on Daily chart, also. Symmetry is very good. 9 candles form XAB & 9 Candles form BCD.


Thursday, April 19, 2012
Gartley turns into Butterfly - Daily GBP/USD
Bearish Gartley has turned into Butterfly. Pattern has better symmetry than it did yesterday. 4-hr. GBP/USD price came close to hitting 161.8% extension of XA in European/US FX trading session this morning. Trade still valid.
Wednesday, April 18, 2012
GBP/USD Bearish Butterfly - 4hr. chart
GBP/USD Bearish Butterfly has formed on 4-hr chart. Also, a Bearish Gartley has formed on Daily chart.
Butterfly pattern completed around 127.2% extension of XA.

Butterfly pattern completed around 127.2% extension of XA.

GBP/JPY Update - Gartley Pattern
Price reached the 38.2% & 50.0% Fibonacci profit target levels. You could place your stop at break-even at this point and let the trade run on any remaining contracts.

Tuesday, April 17, 2012
Bullish Gartley Pattern - GBP/JPY - Daily Chart
Bullish Gartley pattern has formed on Daily, GBP/JPY. Also, potential Bullish Engulfing candle forming. This pattern has very good symmetry.


Thursday, April 12, 2012
GBP/USD – Bearish Gartley Pattern – Daily Chart
Bearish Gartley pattern has formed on Daily GBP/USD chart. Point D spiked just above 61.8% retracement of XA.
Average Daily Range = 146 pips. Risk above 127.2% extension of XA. Gartley would turn into Butterfly above X at 1.6063
 |
| Bearish Gartley - GBP/USD, Daily chart |
Wednesday, April 11, 2012
NZD/JPY – Bullish GARTLEY Pattern – Daily Chart
Bullish Gartley pattern has formed on NZD/JPY Daily chart. Nice Symmetry. Fibonacci Profit Targets drawn in. See chart below.


Sunday, April 8, 2012
AUD/JPY 3-Drives BUY Pattern - Daily Chart
3 - Drives BUY Pattern has formed on AUD/JPY Daily chart. The pattern is further confirmation of our Long AUD/JPY trade off of a Bullish Butterfly pattern. Also, the AUD/JPY gapped down today from Friday's close. It closed Friday @ 84.10 and opened Sunday @ 83.91. These gaps or windows are usually closed by the end of the next trading day.
 |
| AUD/JPY, 3 - Drives Pattern : Daily Chart |
Thursday, April 5, 2012
Trading for a Living
" The market does not know you exist. You can do nothing to influence it. You can only control your behavior."
--- Dr. Alexander Elder, Trading for a Living
--- Dr. Alexander Elder, Trading for a Living
AUD/JPY Butterfly BUY Pattern - Daily & 4-hr. charts
Bullish Butterfly pattern has formed on Daily AUD/JPY chart. Reason for trade: AB = CD pattern. D projection comes in at about 84.12. Candle spiked down to 83.97 just above the 127.2% ext. level. Hammer or Doji may be forming on Daily chart. 4-hr. chart shows same Butterfly pattern. Possible Bullish Engulfing candlestick pattern on 4-hr. chart. Profit targets at 85.75 (38.2%), 86.30 (50.0%), & 86.85 (61.8%).
AUD/JPY Butterfly Buy Pattern - Video
AUD/JPY Butterfly Buy Pattern - Video
Monday, April 2, 2012
GBP/USD Short trade update
Gartley Sell pattern turned into a Butterfly Sell pattern. Still a nice pattern. Risk above 1.6100. Technically, trade would still be a valid Butterfly all the way up to 1.618 extension of XA. Short video below.
Subscribe to:
Comments (Atom)