Showing posts with label GBP/JPY. Show all posts

Saturday, August 24, 2024

Bearish AB = CD Pattern on GBP/JPY 4-HR. Chart

 Bearish AB = CD Pattern on GBP/JPY 4-HR. Chart [Click on chart to view in a Larger format]


GBP/JPY 4-HR Chart with AB=CD Pattern
GBP/JPY 4-hr. Chart with AB=CD Pattern


This Bearish ABCD pattern here is almost exactly an AB=CD pattern. The AB Leg is 303 pips and the CD Leg is 301 pips. The other very interesting thing about this pattern is that the length of time for each section to form is the same.  11 bars for the ABC section and 11 bars for the CD section. The candlestick at point D is a Spinning Top. This was an indication of a potential Reversal also.

Price went down and hit the 38.2% Fibonacci Retracement Level and then traded back up briefly. It hit resistance around previous high and tested the 38.2% Level again.

Very Symmetrical : I've found that the patterns that show the best symmetry tend to be the most useful patterns. (See Chart)

Manage your Risk.  Happy Trading!


Tuesday, July 12, 2022

GBP/JPY - Bullish Engulfing Pattern, 4-HR Chart

 GBP/JPY has formed a Bullish Engulfing candlestick pattern on the 4-hr. chart.  Trade Entry at candlestick open after the Bullish Engulfing candlestick at 162.80.  Profit targets at the 50% and 61.8% Fibonacci Levels.  Stop should be placed below Bullish Engulfing pattern. 


GBP/JPY Bullish Engulfing
GBP/JPY Bullish Engulfing, 4-hr. Chart


Sunday, February 1, 2015

GBP/JPY Long off of 4-hr. chart - Bullish Gartley

The GBP/JPY has formed a Bullish Gartley pattern on the 4-hr. chart.  See chart for details.  Stop placed below X at 174.50.  Markets are very volatile.  Control your risk.


Sunday, September 7, 2014

GBP/JPY Gaps Down from Friday Close

The GBP/JPY gapped down form Friday's (09/05/14) close.  This has produced a nice profit for those of us who traded the Bearish Gartley pattern from my previous post.


Wednesday, July 30, 2014

GBP/JPY Long Trade UPDATE

I am still long the GBP/JPY off of a Bullish Gartley pattern.  See post from July 21, 2014  However,  price has been trading sideways for about 8 days now within a very narrow range.  Will see how news this week moves the market.

Monday, July 21, 2014

GBP/JPY Long Trade - Daily Chart

A Bullish Gartley pattern has formed on the GBP/JPY.  Also, a long-legged doji and hammer candlestick formed around the 78.6% retracement of XA.


Tuesday, September 10, 2013

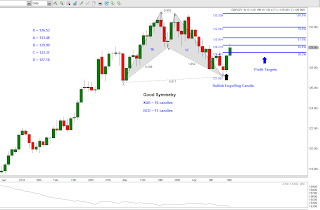
GBP/JPY Butterfly Pattern - Weekly Chart

GBP/JPY Bearish Gartley has turned into a Bearish Butterfly.  1.272AB = CD,  projects point D to be 156.43.  1.618AB = CD,  projects point D to be 158.83.  We are in between these points right now.  If price exceeds 158.83, I would close the trade.  Otherwise, be patient.  Happy Trading.


Monday, September 9, 2013

GBP/JPY Gartley Pattern - Weekly Chart

Bearish Gartley Pattern has formed on Weekly chart of GBP/JPY.  This may turn into a Butterfly pattern but is worth trading at this point.  Stop-loss is set above 156.71, which is point X in the pattern.  I use the average daily range of the pair I am trading to help determine how far away to place my stop-loss.  Some charting packages call this ATR (Average True Range).  You can leave it on the default setting.  The value usually doesn't change significantly.  ATR(14) = 152 pips and ATR(100) = 177 pips.  See chart.  Happy Trading.  : )


Wednesday, April 18, 2012

GBP/JPY Update - Gartley Pattern

Price reached the 38.2% & 50.0% Fibonacci profit target levels.  You could place your stop at break-even at this point and let the trade run on any remaining contracts.


Tuesday, April 17, 2012

Bullish Gartley Pattern - GBP/JPY - Daily Chart

Bullish Gartley pattern has formed on Daily, GBP/JPY.  Also, potential Bullish Engulfing candle forming.  This pattern has very good symmetry.